


It can be difficult to show these practices during a demo event.
Here are three ways to demonstrate such “invisible” climate-smart practices. In every case, it helps to let the host farmer explain what they have already changed and how those changes have led to reduced greenhouse-gas emissions or a farm that is more resilient to extreme weather.
1. Sensory Methods
Working with anything participants can see, touch, hear, smell, or feel is the most accessible way to show the effects of climate-smart practices. Sensory methods are often inexpensive and can be a creative, engaging way to show practices and their effects during a demo.
There are many exercises that use sensory experiences to show the effects of climate-smart farming in a simple way. Some examples include:
- the “soil your undies” test to show microbial activity in the soil;
- slake tests to evaluate soil structure, or earthworm counting to show soil aeration;
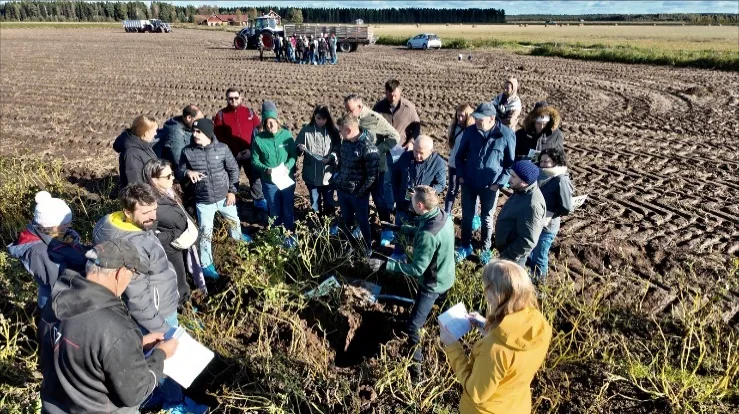
- digging a soil profile pit to show soil and root structure, or comparing plots through a Visual Soil Examination and Evaluation (VESS) test;
- smelling different compost samples to identify differences, such as compost with too much nitrogen (an ammonia smell) compared with healthy compost;
- tasting crops to show the effects of a climate-smart practice on taste or texture;
- examining and handling different fertiliser or compost types, or different types of soil.
“We carried out visual and sensory soil assessment using the different soil samples collected from the farm. Participants were encouraged to evaluate the soil using their senses, observing characteristics such as structure, texture, colour, smell, and biological activity.”
Jacobo Monereo, Spain
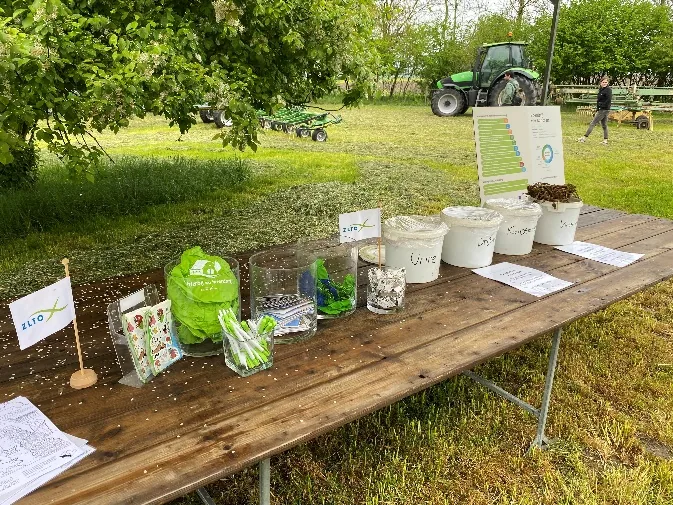
You can make physical props to show a practice on a smaller scale. For example, use buckets of different manure types, buckets with different soil structures to show water-retention differences, or feed samples to smell differences between samples.
Comparison plots are another effective way to show the difference between plots with and without climate-smart farming practices. For example, compare soil pits in ploughed and no-till plots to show differences in soil structure, or pastures receiving different levels of fertiliser nitrogen.
2. Quantification Through Data and Audits
Farmers often appreciate quantification and data that show a farm’s greenhouse-gas emissions, economic effects, or other performance effects. Quantification is more labour-intensive and requires access to relevant data. Some ways to use it in a climate farm demo include:
- carbon-footprint calculators and auditing tools such as CAP2ER, BOVID-CO2, or AgNav to show a farm’s performance in greenhouse-gas emission reduction;
- the Adaptation and Mitigation Plans of the ClimateFarmDemo project to show farm emissions and trends over time. These plans can be visualised using information boards, as in this demo in The Netherlands.
“We used CAP2ER reports and graphical outputs for real farms from Veneto and Emilia-Romagna, with slides showing emission breakdowns and mitigation scenarios. These materials helped participants visualise where emissions occur and which management changes could have the greatest impact.”
Flavio Luongo, Italy
3. Digital Visualisation
Use digital tools to calculate emissions and the effects of climate-smart measures, then visualise or display them in a precise, attractive, and easy-to-understand way. Like quantification, digital visualisation is more labour-intensive and can be more expensive than sensory methods.
- Real-time monitoring: use digital platforms and sensors to visualise data such as soil moisture, temperature, nutrient status, or animal welfare indicators.
- Thermal imaging: use thermal cameras to show crop-water stress, animal heat stress, or temperature differences between soils and surfaces.
- Precision mapping: use drone imagery, satellite data, or GIS maps to visualise crop performance, soil variability, or climate risks across the farm.
- Simulations: use tools such as ClimAléas Diag, NDICEA, or Klimaatstresstest to make potential climate impacts and responses visible. Find more climate and carbon assessment tools in the FarmingForClimate repository.